Clustering for deeper data insights#
Clustering exploits inherent structures in data to find relationships and memberships to groups in an unsupervised way. It can be used for data mining to generate additional insights.
Clustering is a popular technique used in data analysis to group similar data points together based on their inherent patterns and structures.
It enables researchers and analysts to uncover hidden relationships within data sets and better understand complex systems. With the increasing volume of data generated by organizations and individuals, clustering has become a valuable tool for mining and exploration. Using clustering algorithms, it is possible to identify distinct subgroups within large data sets and gain deeper insights into complex phenomena, such as customer behaviour, market trends, and scientific phenomena.
In this article, we will explore the benefits of clustering for deeper data insights and discuss some of the most popular clustering algorithms used today.
How To#
from sklearn.model_selection import train_test_split
import pandas as pd

df = pd.read_csv("data/housing.csv")
df.head()
| longitude | latitude | housing_median_age | total_rooms | total_bedrooms | population | households | median_income | median_house_value | ocean_proximity | |
|---|---|---|---|---|---|---|---|---|---|---|
| 0 | -122.23 | 37.88 | 41.0 | 880.0 | 129.0 | 322.0 | 126.0 | 8.3252 | 452600.0 | NEAR BAY |
| 1 | -122.22 | 37.86 | 21.0 | 7099.0 | 1106.0 | 2401.0 | 1138.0 | 8.3014 | 358500.0 | NEAR BAY |
| 2 | -122.24 | 37.85 | 52.0 | 1467.0 | 190.0 | 496.0 | 177.0 | 7.2574 | 352100.0 | NEAR BAY |
| 3 | -122.25 | 37.85 | 52.0 | 1274.0 | 235.0 | 558.0 | 219.0 | 5.6431 | 341300.0 | NEAR BAY |
| 4 | -122.25 | 37.85 | 52.0 | 1627.0 | 280.0 | 565.0 | 259.0 | 3.8462 | 342200.0 | NEAR BAY |
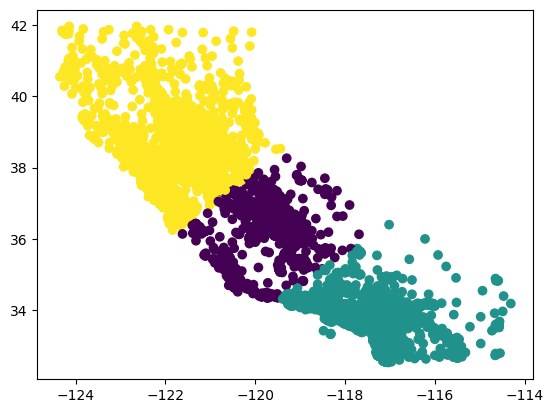
from sklearn.cluster import KMeans
km_cl = KMeans(n_clusters=3)
labels = km_cl.fit_predict(df[["longitude", "latitude"]])
import matplotlib.pyplot as plt
plt.scatter(df.longitude, df.latitude, c=labels)
<matplotlib.collections.PathCollection at 0x7f8dbc0bf700>
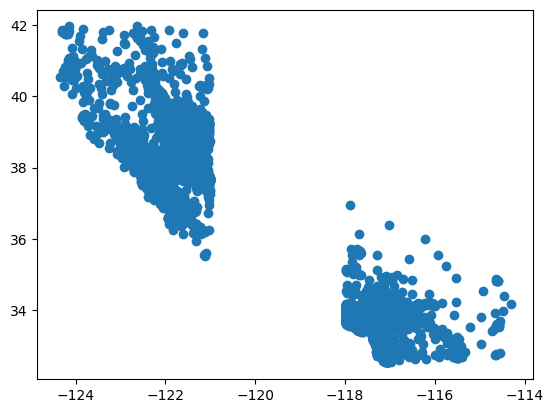
split_data = df[~df.longitude.between(-121, -118)]
plt.scatter(split_data.longitude, split_data.latitude)
<matplotlib.collections.PathCollection at 0x7f8db3fabc10>
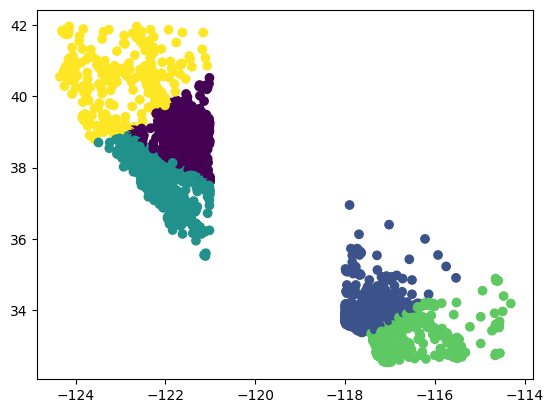
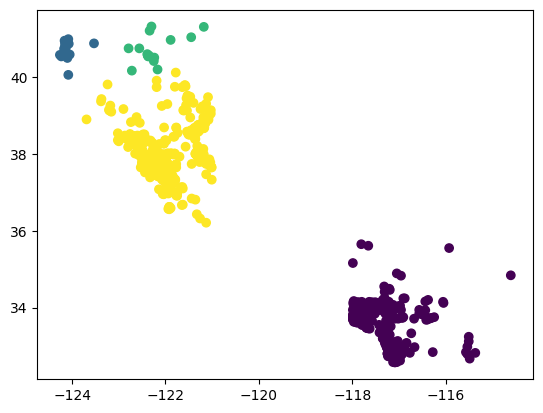
km_cl = KMeans(n_clusters=5)
labels = km_cl.fit_predict(split_data[["longitude", "latitude"]])
plt.scatter(split_data.longitude, split_data.latitude, c=labels)
<matplotlib.collections.PathCollection at 0x7f8db3f32af0>
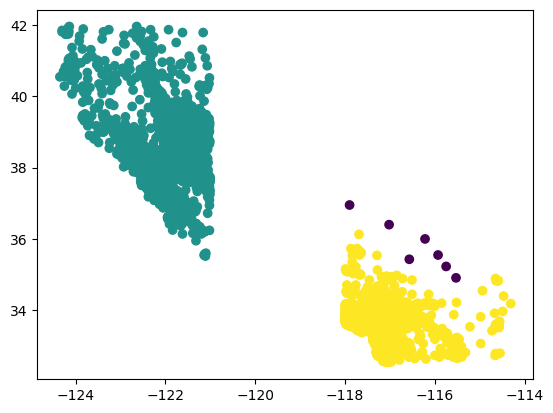
from sklearn.cluster import DBSCAN
db = DBSCAN()
labels = db.fit_predict(split_data[["longitude", "latitude"]])
plt.scatter(split_data.longitude, split_data.latitude, c=labels)
<matplotlib.collections.PathCollection at 0x7f8db3e8c3d0>
from sklearn.cluster import SpectralClustering
sp = SpectralClustering(n_clusters=4)
split_data = split_data.sample(1000)
labels = sp.fit_predict(split_data[["longitude", "latitude"]])
plt.scatter(split_data.longitude, split_data.latitude, c=labels)
<matplotlib.collections.PathCollection at 0x7f8db3ba8250>
Exercise#
Try different clustering algorithms. Venture out and explore HDBSCAN.