Basics of data visualization#
We used data visualizations throughout this course. Here, we explore how to modify and enhance these figures.
Data visualization presents information and data using visual elements such as charts, graphs, and maps.
It is a powerful tool that can help us understand complex data sets quickly and efficiently, enabling us to make better-informed decisions. In this notebook, we will delve into the basics of data visualization, including the types of visualizations commonly used, their benefits and limitations, and some tips and tricks to enhance and modify these figures to better communicate our insights.
Whether you are a data analyst, researcher, or simply someone interested in exploring data, this notebook will provide the necessary foundational knowledge to create effective and impactful data visualizations.
How To#
import pandas as pd

df = pd.read_csv("data/housing.csv")
df.head()
| longitude | latitude | housing_median_age | total_rooms | total_bedrooms | population | households | median_income | median_house_value | ocean_proximity | |
|---|---|---|---|---|---|---|---|---|---|---|
| 0 | -122.23 | 37.88 | 41.0 | 880.0 | 129.0 | 322.0 | 126.0 | 8.3252 | 452600.0 | NEAR BAY |
| 1 | -122.22 | 37.86 | 21.0 | 7099.0 | 1106.0 | 2401.0 | 1138.0 | 8.3014 | 358500.0 | NEAR BAY |
| 2 | -122.24 | 37.85 | 52.0 | 1467.0 | 190.0 | 496.0 | 177.0 | 7.2574 | 352100.0 | NEAR BAY |
| 3 | -122.25 | 37.85 | 52.0 | 1274.0 | 235.0 | 558.0 | 219.0 | 5.6431 | 341300.0 | NEAR BAY |
| 4 | -122.25 | 37.85 | 52.0 | 1627.0 | 280.0 | 565.0 | 259.0 | 3.8462 | 342200.0 | NEAR BAY |
import matplotlib.pyplot as plt
plt.figure(figsize=(10,2))
plt.plot(df.population, df.median_house_value, 'ro', label="House")
plt.plot(df.population, df.median_house_value, 'kx', label="House 2")
plt.title("Value by Population")
plt.xlabel("Population")
plt.ylabel("House Value")
plt.legend()
plt.show()
# plt.savefig("figure.png", dpi=300)
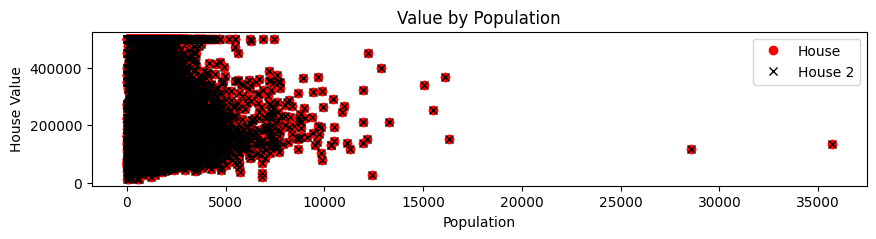
Image Data#
plt.imshow()
---------------------------------------------------------------------------
TypeError                                 Traceback (most recent call last)
Cell In[4], line 1
----> 1 plt.imshow()

TypeError: imshow() missing 1 required positional argument: 'X'
Seaborn#
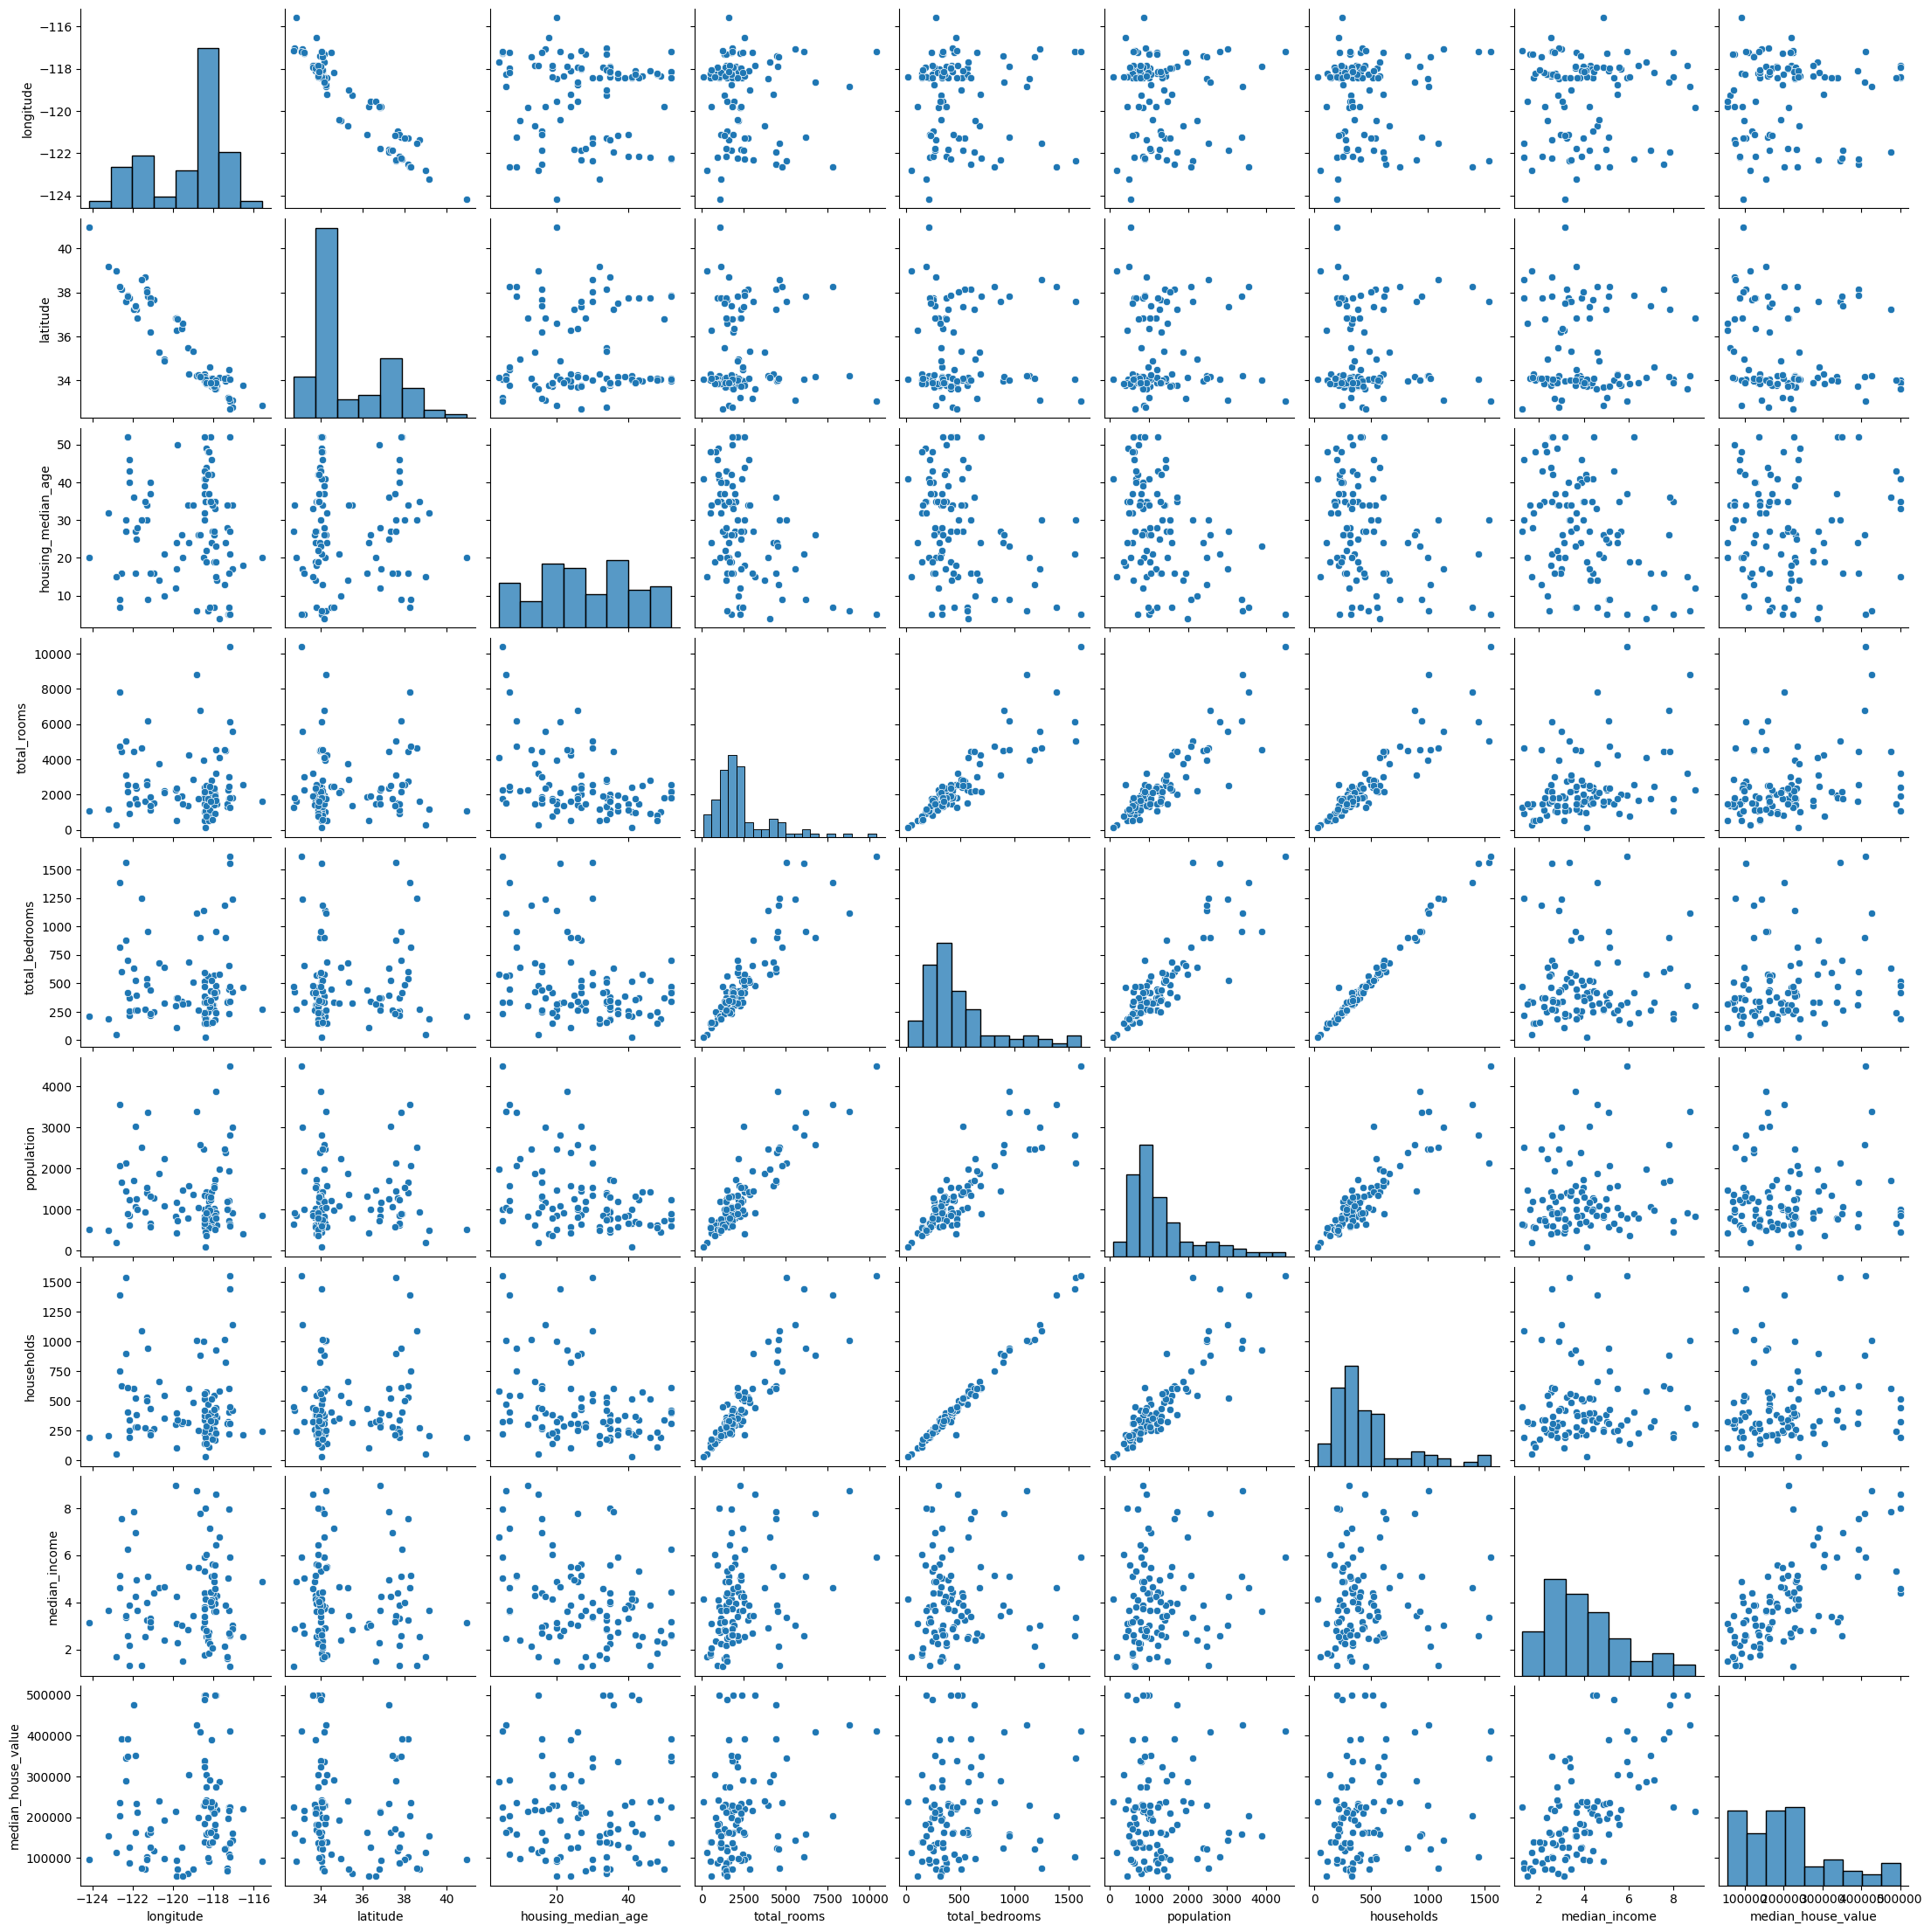
import seaborn as sns
plt.figure(figsize=(10,10))
sns.pairplot(df.sample(100))
plt.savefig("seaborn.png")
<Figure size 1000x1000 with 0 Axes>
Pandas#
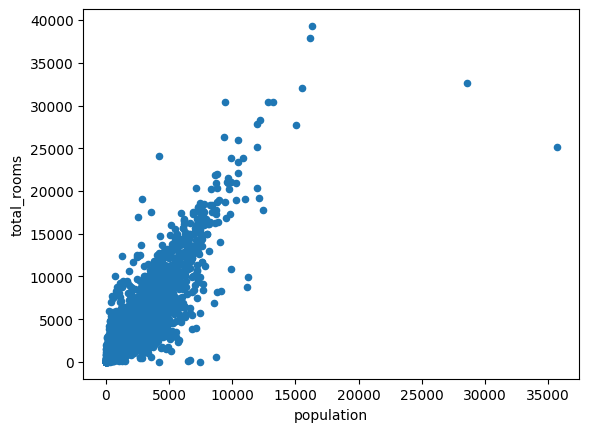
df.plot("population", "total_rooms", "scatter")
<Axes: xlabel='population', ylabel='total_rooms'>
Exercise#
Experiment with the plotting capabilities in Matplotlib and Seaborn